

Plasma Diagnostics
Thomson scattering system
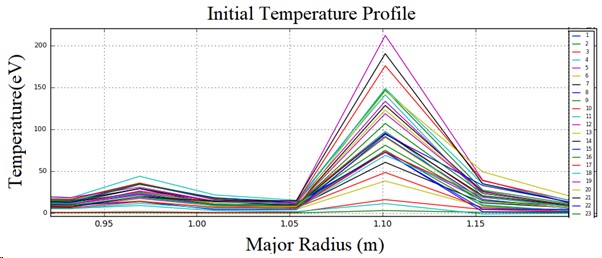
A multi point Thomson scattering system is installed on SST-1 involving 6 Nd:YAG lasers. Out of the 20 spatialpoints planned for the core, edge and diverter plasma, 8 spatial points are installed and are operational.
The temperature range of measurement for the core system is from 100 eV to 1 keV and dnesity above 2x10¹²/cc. Another Thomson scattering system with similar parametric range is in the stage of comissioning for ADITYA-U tokamak as well.

Schematic of SST-1 Thomson scattering

Thomson scattering signal recorded on DSO


Estimated temperature and density using TS diagnostics in the recent campaign.
Detailed information is available in the following references.
References:
1) Design of multipulse Thomson scattering diagnostic for SST-1 tokamak, Review of Scientific Instruments 78, 043507 (2007); https://doi.org/10.1063/1.2724775
2) Design and development of five-channel interference filter polychromator for SST-1 Thomson scattering system. Fusion Engineering and Design 87, Issue 2, February 2012, Pages 134-140. https://doi.org/10.1016/j.fusengdes.2011.11.010
3) Design and development of distributed control system for SST-1 Thomson scattering experiment. https://doi.org/10.1088/1748-0221/8/11/t11005
4) Gated integrator PXI-DAQ system for Thomson scattering diagnostics. https://doi.org/10.1016/j.fusengdes.2017.04.064
Microwave interferometer
A microwave Interferometer is a widely used and established system for line integrated plasma density measurement of fusion plasma. It is based on a principle of phase shift. A microwave beam will experience a phase shift while traversing through the plasma with respect to the reference arm. A change in phase is related to the change in refractive index and change is refractive index is related to the change in plasma density. Hence, by knowing the phase shift of the microwave beam coming out of the plasma will provide the information of the plasma density. Microwave interferometer system measures plasma line averaged density using millimeter wave frequency (30- 300 GHz). There are two types of techniques (1) Homodyne (2) Heterodyne. In a homodyne, only one source of frequency has been used as a probing frequency and for the down conversion of a signal coming out of the plasma. In the case of Heterodyne, two frequency sources of slightly different frequencies have been used. As a result, even in the absence of the plasma the Intermediate frequency is not zero while in the Homodyne it is zero. Both the systems have been established for the line integrated density measurement in Tokomak at IPR. A Homodyne System of 100 GHz is a multi-chord system, 6-channels for Aditya-U. Due to the multi chord, a radial profile for plasma density can be obtained. A single channel 100GHz system has established for SST Tokomak. A Heterodyne system of 140 GHz is a single channel phase-locked loop system is used for Aditya as well as SST. A 100 GHz single channel quadrature based (IQ) heterodyne interferometer is indigenously developed and commissioned for ADITYA-U Tokomak for real-time electron density measurement during plasma discharges. Both heterodyne system gives a real time plasma density. This real time signal can be used for density control and feedback.
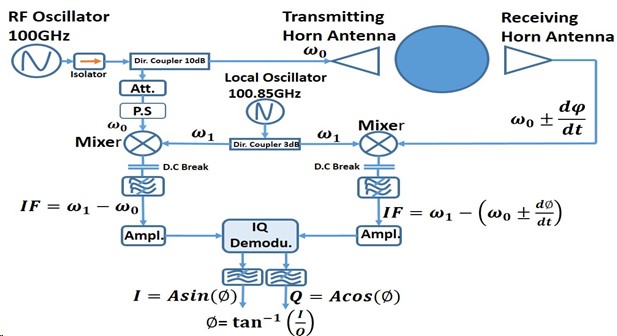
Schematic block diagram of 100 GHz Developed heterodyne system
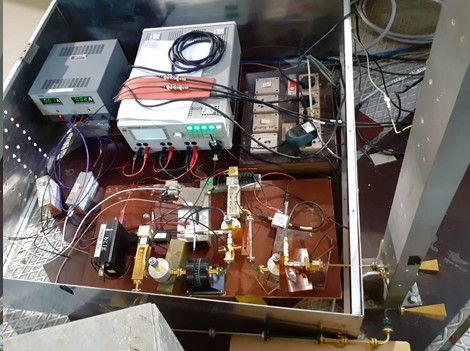
100 GHz Heterodyne system at ADITYA- U Tokomak
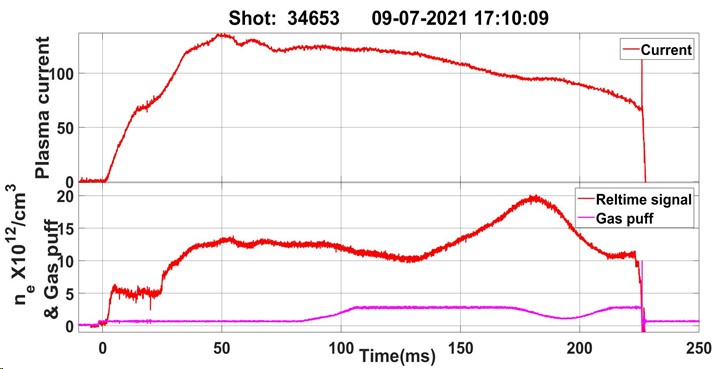
Plasma current, real-time density and gas feed back
References:
1) “Design & development of 140 GHz D-band phase locked heterodyne interferometer system for real-time density measurement”.
U.C. Nagora, A. Sinha, S.K. Pathak, P. Ivanov, R.L. Tanna, K.A. Jadeja, K.M. Patel and J. Ghosh,
Journal of Instrumentation (JINST), Vol.15, P11011, November 2020, https://doi.org/10.1088/1748-0221/15/11/P11011.
2) Design and Development of 100GHz Quadrature Heterodyne Interferometer System at IPR. Umesh Nagora, Kiran Patel and S. K. Pathak, October 2020 IPR/TR-599/2020.
3) FPGA Based Real-time Data Acquisition System for ADITYA-U Heterodyne Interferometry
Kiran Patel, Umesh Nagora, H. C. Joshi, Surya Pathak, K.A.Jadeja,Kaushal Patel, R.L.Tanna and ADITYA-U Team IPR/TR-598/2020.
MICHELSON INTERFEROMETER DIAGNOSTICS
INTRODUCTION
Michelson interferometer is a two port instrument used for interferometry applications and was invented by American physicist Albert Abraham Michelson. Here with the help of a beam splitter the incoming beam is split into two parts. With the help of mirrors, each of these beams is reflected back toward the beam splitter which then combines their amplitudes using the superposition principle. The resulting interference pattern is directed towards the detector. In principle the Michelson interferometer translates the difference intensity spectrum available at the two input ports into an interferogram at each output port according to the diagnostic sensitivity. Michelson interferometer diagnostics is installed on SST-1 tokamak at IPR. The diagnostic measures electron temperature profile and its evolution up to several harmonics by probing the full electron cyclotron emission (ECE) spectrum emitted by high-temperature plasmas in fusion experiments. The diagnostics measures the ECE spectrum in the spectral range 70–500 GHz and determines broadband plasma temperature profile.
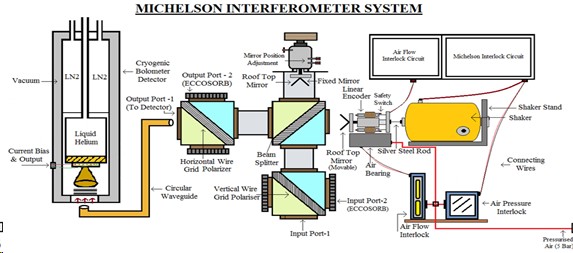
System Layout
OBJECTIVE: Determination of Plasma Electron Temperature Profile
Michelson Interferometer System
TABLE: SYSTEM SPECIFICATIONS
Technical Parameters
| Specifications
|
Operating Frequency
| 70 – 500 GHz
|
Spectral Resolution
| 3.66 GHz
|
Temporal Resolution
| ≈ 17 ms
|
Mirror Amplitude
| ≈ 17 mm
|
ADC Resolution
| 16 bit
|
Measurement Results
References:
1) Broadband Characterization of High Temperature Black Body Source with Fourier Transform Michelson Interferometer for ECE Measurements
Abhishek Sinha, S K Pathak, Stefan Schmuck and John Fessey
Preprint: IAEA FEC 2018
2) Design and Simulation of High Temperature Blackbody Calibration Source Michelson Interferometer Diagnostic
N Parmar, Abhishek Sinha and S. K. Pathak
Fusion Engineering & Design, 172, November 2021, 112752
3) Design, Simulation, Testing & Installation of Wave Collection and Transport System for Michelson Interferometer Diagnostic at SST-1 Tokamak
Abhishek Sinha, Sonam Sharma and S. K. Pathak
IPR/TR-532/2019 – February 2019
4) Assembly and Characterization of Fourier Transform MI Diagnostic
Abhishek Sinha, S. K. Pathak, John Fessey and Stefan Schmuck
IPR/TR-457/2018 – January 2018
5) Calibration of Michelson Interferometer Diagnostics and Measurements with Monochromatic Source
Abhishek Sinha, S. K. Pathak, Stefan Schmuck and John Fessey
IPR/TR-435/2017 – July 2017
ECE Radiometer Diagnostic
The electron temperature is one of the important basic parameters for magnetically confined tokamak plasmas. Measurement of electron cyclotron emission (ECE) is considered as a powerful diagnostic for determination of electron temperature profile and its fluctuations with good temporal and spatial resolution as long as the plasma behaves as a black body. Benefiting from its high spatial and temporal resolution, heterodyne radiometry is routinely applied in tokamaks for temperature measurements
Principle: As a result of Lorentz force, charge particles gyrate around the magnetic field lines and consequently exhibit helical motion and emit electromagnetic radiation; the so-called Cyclotron emission. The electron cyclotron frequency is given by
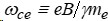
Where, e and me are charge and mass of electron while B is the toroidal magnetic field while γ is the relativistic factor
ECE Radiometer Diagnostic @ Aditya-U Tokamak
A 16-channel Radiometer system is installed & operational at Aditya-U tokamak to measure the Electron Cyclotron Emission (ECE) in the second harmonic frequency range of 65-83 GHz for the X-mode at a magnetic field of 1.2T. Following are the salient features of the receiver system:


a) Diagnostic operational in Aditya-U and
b) Temporal & spatial Te profile for a discharge at Adiya-U.
Publications:
1) “Characterization and calibration of 8-channel E-band heterodyne radiometer system for SST-1 tokamak”, Varsha Siju, Dharmendra Kumar, Praveena Shukla, and S. K. Pathak, Review of Scientific Instruments, Vol. 85, (2014).
2) “Design of RF AGC scheme for improving dynamic range of multichannel heterodyne ECE radiometer in SST-1 Tokamak”, Dharmendra Kumar, Varsha Siju, Surya K. Pathak, Fusion Engineering and Design (2016)
3) “Preliminary Results from Electron Cyclotron Measurements at SST-1”, Varsha Siju and Surya K Pathak, Journal of Physics: Conference Series, Volume 823, (2015)
4) “Application of automatic gain control for radiometer diagnostic in SST-1 tokamak.” Foram R.Makwana,Varsha siju,S.K.Pathak, Review of Scientific Instruments, Vol 15, (2017)
5) “Design and Characterisation of Radiometer system for electron cyclotron measurements at Aditya-Upgrade tokamak”Varsha Siju, R.L.Tanna, Jayesh R., Umes.N, Praveena S., & S.K.Pathak. JINST (2021)
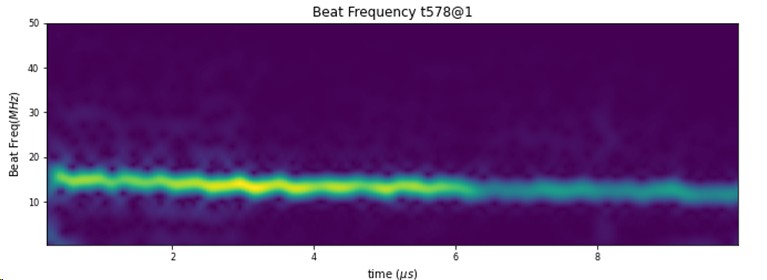
Ultrafast Superhetrodyne FMCW in K and Ka-Band (18-40GHz) Reflectometry.
Measures: Electron Density Profile ne(r, t) every millisecond from 0.4 to1.9 x 1019 m-3
Spatial / Time resolution: 1 or 1.5cm/10 μs.
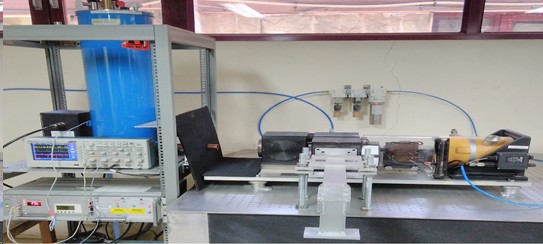
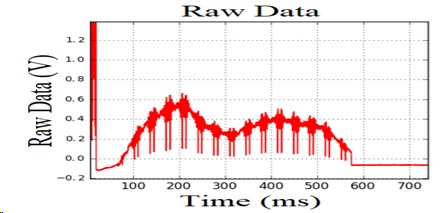
Reflectometer is an ultra-wide band and ultra-fast radar like diagnostic which operates in 18-28GHz and 26-40GHz frequency ranges. It is capable of measuring radial density profile in 0.4-1.9 10^19 m-3 ranges. It sweeps the complete frequency range in 5 microseconds which enable hundreds of profile measurements in a single plasma shot. Spatial resolution for the system is 1cm approx. It employs superhetrodyne architecture in conjunction with quadrature phase detection for vector frequency measurements. The complete system has been developed in-house from scratch including the microwave hardware, wave transport and collection system, trigger and driver section and also the digital signal processing code.

Bench test results. a) raw data, b) measured linearized phase and c) measured beat freq.

Magnetic Diagnostics
Magnetic diagnostics provide the most basic information about the plasma including plasma current, loop voltage and plasma position. It also enables the equillibrium reconstruction of the plasma and helps in the study of magnetohydrodynamic (MHD) instabilities. Magnetic diagnostics include inductive probes, Hall probes and magneto optic current sensors. The inductive probes measure the change in the magnetic field (flux) and hence require active integrators for magnetic field measurement whereas the Hall probes and magento-optic current sensors are used for steady state magnetic field measurement.The inductive probes include the Rogowski coils, which are used for plasma current measurement, voltage loops for measurement of the breakdown electric field,diamagnetic loop for plasma thermal energy measurement and magnetic coils for plasma position measurement. Both Aditya-U and SST-1 are equipped with multiple magnetic diagnostics.

Figure: Schematic of the magnetic diagnostics in tokamak
Measurement
| Available Diagnostics Technique
| |
Aditya-U
| SST-I
| |
Plasma Current, Ip
| 4 Internal Rogowski coils
| 6- 2 full, 4 segmented Rogowski
|
Loop voltage, Vloop
| 4 Inside, 4-outside
| 23 loops
|
Plasma Kinetic Energy
| Diamagnetic loop
| 2 set of diamagnetic loops
|
MHD modes, Plasma position
| 2 sets of 16 probes, toroidally 180° apart, Mirnov coils
| 2 garlands of 24 and 8 coils
|
Table: Magnetics Diagnostics in Aditya-U and SST-1
Recent Results: Aditya-U
Results are shown for the thermal energy and plasma position measurement in a typical Aditya-U discharge. The poloidal magnetic field in the plasma exerts an radially inward force while kinetic presuure of plasma exerts an radially outward force across the poloidal cross-section of plasma . The difference between these forces is balanced by toroidal magnetic field by changing its magnitude. This changing magnetic field is measured by the diamagnetic diagnostics and is used to estimate plasma thermal energy.
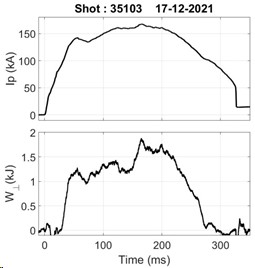
Plasma thermal energy measurement in Aditya-U shot 35103 (L) and Plasma position measurement in Aditya-U shot 35122(R)
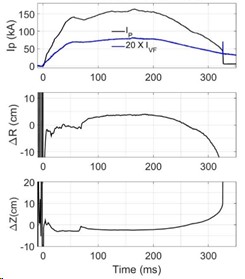
Recent Results: SST-1
In SST-1, 12 magnetic probes (A-I) are mounted in a poloidal plane along the plasma boundary for magnetic field measurements. The measurements of plasma current and vertical field coils current are performed by their respective Rogowski coil. Using algorithm based on Function parameterization method, radial and vertical positions (∆R and ∆Z) of plasma current from machine center for SST-1 discharges is estimated.
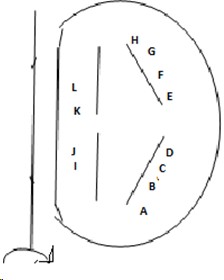
New installation: Probes installed on OPS in SST-1 during vessel opening; A-L represents magnetic probes arranged in a poloidal plane around plasma column
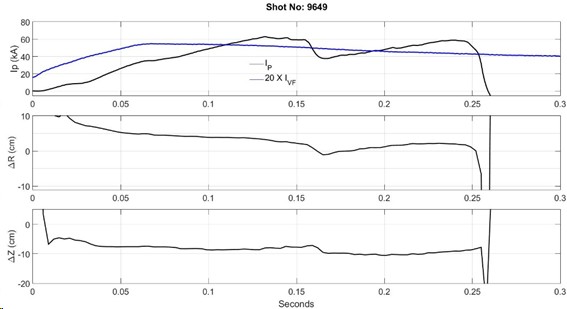
Plasma position measurement in a typical SST-1 plasma shot
1) Application of Function Parameterization Method For the Determination of Plasma Current in Aditya-U Tokamak, SAMEER KUMAR, KUMUDNI TAHILIANI, DANIEL RAJU, S. K. PATHAK, JAYESH RAVAL, PRAVEENLAL EDAPPA, PRAVEENA KUMARI, DEVILAL KUMAVAT, M. V. GOPALAKRISHNA, ROHIT KUMAR and
ADITYA-U TEAM, IPR/RR-1173/2020, JUNE 2020
2) Diamagnetic flux measurement in Aditya, Sameer Kumar, Ratneshwar Jha, Praveen Lal, Chandresh Hansaliya, M. V. Gopalkrishna, Sanjay Kulkarni and Kishore Mishra, , Review of Scientific Instrument Vol. 81, 123505 (2010)
Bolometer DIAGNOSTICS
A significant fraction of the input power supplied to the tokamak is radiated away through the process of Bremsstrahlung and by the line radiation from bound electrons of impurities inevitably present in the plasma. The radiation power loss in present day tokamaks may account for up to 100 % of the input power depending on operation regime and the geometrical size of the tokamak. The diagnosis of this radiation power loss plays a crucial role in determining the power balance of the plasma and the energy confinement time. It is also an important parameter in the study of disruptions and instabilities.
The radiation emitted from the plasma ranges from the visible to vacuum ultraviolet up to the soft x-ray region of the electromagnetic spectrum and is measured using bolometer diagnostics. The system consists of a multichannel detector array that images the plasma through a pin hole. Since the atmosphere absorbs the vacuum ultraviolet radiation, the bolometer detectors are kept inside the vacuum vessel. The detectors are absolutely calibrated having a high sensitivity (0.27 A/W) and a nearly constant response over and µs order time resolution.
Bolometer System in Aditya-U
The bolometric system on Aditya-U consists of two bolometer cameras mounted on radial and top port 20. The top port camera is equipped with a 20-channel linear detector array whereas the radial port camera has one 20-channel array and 2 single channel detectors, each mounted behind a pin-hole. The single channel detectors have a 2-pi view and thus measure the total radiation and the arrays provide spatial emission.

Line of sight of radial Bolometer Camera in Aditya-U: 2-pi bolometer (blue) and 20 channel array (black), Bandwidth – 10 kHz, Spatial Resolution – 2-3 cm
Temporal evolution of total radiation power loss in Aditya-U tokamak
Bolometer System in SST-1
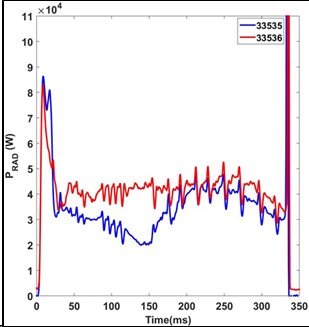
The bolometer diagnostic system on SST-1 tokamak consists of a pinhole camera having an array of 20 detectors that image the plasma from th radial port 15 and provides line integrated measurements of the plasma emission with a spatial resolution of ~2 cm at the plasma mid-plane. These line-integrated measurements are then used for the determination of the total radiation power loss and are inverted to obtain the emission distribution. In Aditya-U tokamak, both 2-pi and array of bolometer are used for the measurement of total power loss and the emissivity distribution
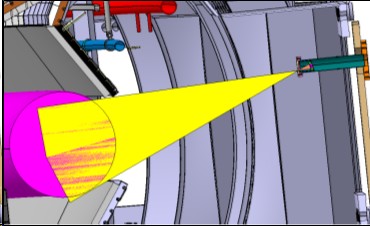
Bolometer Camera in SST-1: 20 channel array mounted on radial port 15

References
1) Radiation Power Loss Study During Gas Puff Induced Disruptions in Aditya-U, K.TAHILIANI, M.B. CHOWDHURI, M.V.GOPALAKRISHNA, K.A.JADEJA, K.M.PATEL, P. KUMARI, U.C.NAGORA, J.RAVAL, H.RAJ, L.T.LACHVANI, S.PANDYA, R.MANCHANDA, P.K.ATREY, S.K.PATHAK, R.L.TANNA, J.GHOSH, A.KUMAR, October 2018, 27th IAEA Fusion Energy Conference
(FEC-2018), https://nucleus.iaea.org/sites/fusionportal/Shared%20Documents/FEC%202018/fec2018-preprints/preprint0692.pdf
2) Estimation of Effective Responsivity of AXUV Bolometer in ADITYA Tokamak by Spectrally Resolved Radiation Power Measurement, Kumudni TAHILIANI, Ratneshwar JHA, Prabhat KUMAR, ADITYA Team January 2013, Plasma and Fusion Research 8:2402124-2402124, DOI: 10.1585/pfr.8.2402124
3) Kumudni Tahiliani, Santosh P. Pandya, Shwetang Pandya, Ratneshwar Jha, and J. Govindarajan, "Nondestructive test of brazed cooling tubes of prototype bolometer camera housing using active infrared thermography", Review of Scientific Instruments, Vol. 82, Issue 1, 014901 (2011), DOI: 10.1063/1.3506396
4) Radiation power measurement on the ADITYA tokamak, Kumudni Tahiliani, Ratneshwar Jha, M V Gopalkrishana, Kalpesh Doshi, Vipal Rathod, Chandresh Hansalia and the ADITYA team, July 2009, Plasma Physics and Controlled Fusion 51(8):085004,DOI: 10.1088/0741-3335/51/8/085004
5) STUDY OF A PROTOTYPE METAL FOIL BOLOMETER IN THE LAB, DEVILAL KUMAWAT, KUMUDNI TAHILIANI, PRAVEEN LAL E.V., R. JHA, M. V. GOPALAKRISHNA and S. K. PATHAK, IPR/RR-1261/2021, MARCH 2021
Magneto-Optic Current Sensor (MOCS) diagnostics
Measurement of the plasma current is the most direct evidence to determine the merit of a plasma discharge in tokamaks and a fundamental parameter for plasma diagnostic. Reliable measurement of plasma current is an important parameter for basic control and machine protection.
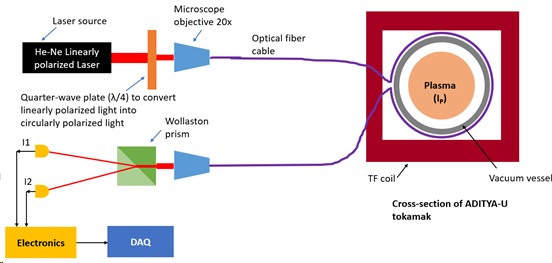
Magneto-optic Current Sensor (MOCS) is employed for the measurement of steady state plasma current and is based on the principle of Faraday effect. In MOCS, the plasma current is directly estimated by measuring the rotation angle of the polarized light passing through the optical fiber-loop nearly enclosing the plasma current channel.
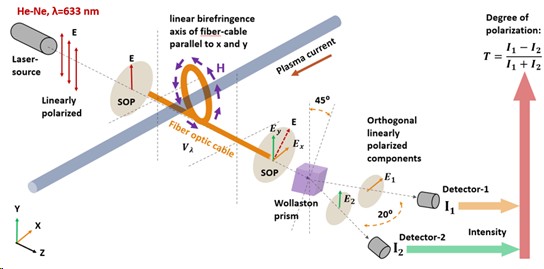
Schematic diagram of the first phase MOCS diagnostic setup installed on the ADUTYA-U tokamak for plasma current measurement
A prototype MOCS diagnostic has recently been developed for ADITYA-U tokamak. The prototype MOCS system has been characterized in a Lab setup environment and also the first results of plasma current estimation up to ~150 kA were obtained for plasma discharges. MOCS measurements for the representative plasma discharges in ADITYA-U tokamaks is shown and a comparison of the MOCS signal with the Rogowski coil. The preliminary results show a reasonable and consistent agreement with the Rogowski coil.
Schematic diagram of the first phase MOCS diagnostic setup installed on the ADUTYA-U tokamak for plasma current measurement
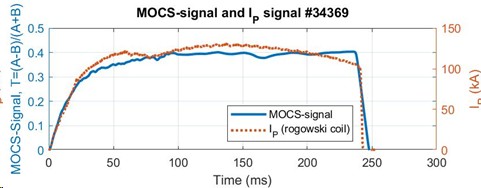
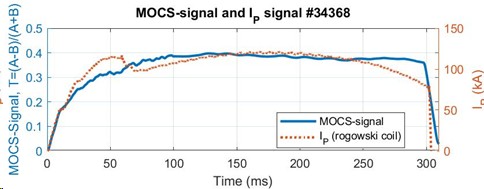
First results from the MOCS diagnostic installed on the ADITYA-U tokamak and comparison of MOCS-signal with Rogowski-coil signal during long pulse plasma discharges.
References:
1) Santosh P. Pandya, Kumudni Tahiliani, Praveenlal E. V., Lavkesh T. Lachwani, Sameer Kumar Jha, M .V. Gopalakrishna and Surya Kumar Pathak, "Initial lab test results of Magneto-Optic Current Sensor diagnostic developed for plasma current measurement in tokamaks", 29th DAE-BRNS National Laser Symposium (NLS-29) held on February 12-15, 2021, Indore, contributory paper in Laser and Fiber-based Instrumentation in E-publication/proceedings of the conference, CP-11-644, pp564-568. https://ila.org.in/images/nls29/nls29_ebook.pdf
2)Santosh P. Pandya, Kumudni Tahiliani, Praveenlal E. V., Sameer Kumar Jha, Lavkesh T. Lachwani, Suman Aich, Surya Kumar Pathak, Rakesh L. Tanna, Joydeep Ghosh and ADITYA-U team, "First results of recently developed prototype Magneto-Optic Current Sensor (MOCS) diagnostic for plasma current measurements in ADITYA-U tokamak", Abstract ID: OP-01, Page#42, 2nd International Conference on Advances in Plasma Science and Technology (ICAPST), Organized by Department of Physics, Sri Shakthi Institute of Engineering and Technology, Coimbatore - 641062, India. May 27-29, 2021.
Fast Visible Imaging Diagnostics
The core temperature in tokamak plasmas is of the order of kilo electron volts and hence the radiation emission mainly lies in the X-ray and vacuum ultraviolet range. However, the edge plasmas are cooler and the interaction with the limiter results in emission in the visible range. Capturing this visible emission using fast imaging cameras helps in recording the real time evolution of the plasma discharge and the plasma column movement.
In the fast visible imaging diagnostics (FVID), a complementary metal oxide semiconductor (CMOS) based camera coupled with an optical imaging fiber bundle is used for tangential imaging of poloidal cross section of the plasma at a frame rate of up to 26000 frames per second. The front end of the fiber is mounted on the vacuum vessel behind a viewport or inside a re-entrant port whereas the back end is connected with the camera through a 1:1 relay lens. The camera is operated from the control room and image acquisition is initiated by the external TTL pulse via the ethernet cable.

Figure: Top and side view of the camera in SST-1 (RP#13) (L) and fibre optic bundle on Aditya-U (RP#17)
Result Results
Aditya-U Tokamak
The evolution of a typical plasma discharge is shown in pseudo colour. In most of the plasma discharges, the first plasma image is observed after 2 ms of the power initiation in the central solenoid of the tokamak. At 20 ms, plasma limiter interaction at the out-board side is seen. Dust particles are observed when plasma interacts with Plasma facing components (PFCs). In most of the plasma discharges, disruption happens on the in-board side of the tokamak.

Plasma discharge evolution (Shot#34667)
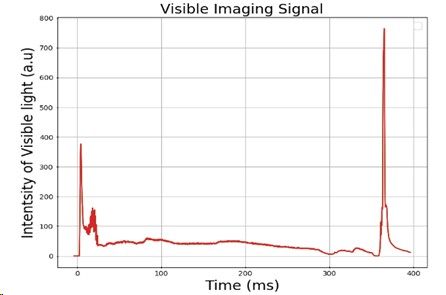
Intensity of light from the camera
SST-1 Tokamak

Evolution of plasma discharge #9714 of SST-1 tokamak in pseudo colour (ECRH triggered at -60 ms)
The horizontal movement of the plasma discharge #9714 shows peaks (at 50, 65 &158 ms) corresponding to the plasma PFCs interaction in the outboard side of the tokamak. Moreover, negative peak at 413 ms represents the plasma disruption at in-board side of the tokamak.
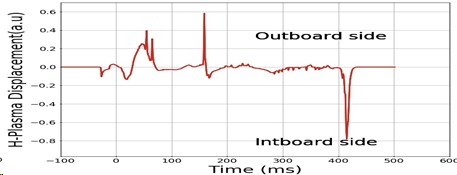
Temporal profile of horizontal plasma movement for the plasma discharge #9714
Charge exchange Neutral particle analyzer diagnostic
Energetic neutral particles that are formed due to charge exchange of plasma ions with neutral atoms escape the plasma readily since neutral do not interact with electric or magnetic fields of tokamaks. These neutral atoms which are re-ionized and analyzed give the information about the plasma ion energy distribution. Core-ion temperature measurements are carried out by the energy analysis of these neutrals. The working principle of the Charge exchange Neutral particle analyzer diagnostic (CX-NPA) is evident from the following schematic layout.
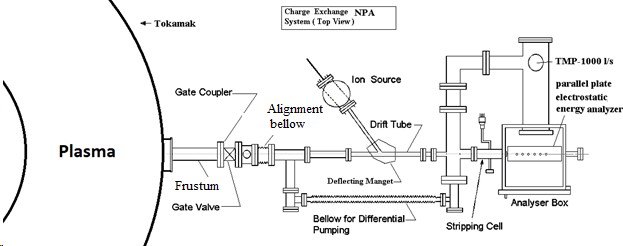
Schematic layout of the Charge Exchange NPA
The neutral particles which escape the plasma enters the stripping cell where they are re-ionized and then analyzed using a 45° parallel plate electrostatic energy analyzer. The top plate of the electrostatic analyzer is positively biased and the bottom plate is at ground potential. This ground plate has entrance and exit apertures. The entrance aperture exactly facing the stripping cell accepts the incoming particles. The charged particles (positive ions), under the influence of a retarding field, follow a parabolic path and fall on the detectors placed at the exit apertures. This range or distance covered by the charged particle in a constant electrostatic field depends upon their energy. Hence by placing the detectors at different exit apertures, the counts of particles of different energies can be obtained. This energy distribution of neutrals reflects the energy distribution of ion component in the plasma and hence the ion temperature.
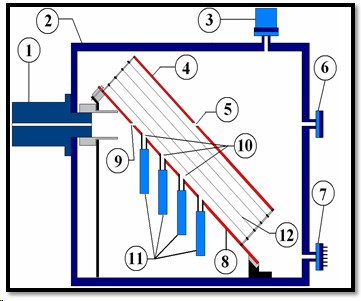
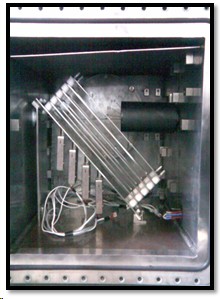
Schematic layout of the CX-NPA analyzer and its Photograph. Components inside CX-NPA are: (1) Stripping Cell, (2) Analyzer Box, (3) Pressure Gauge, (4) Positive Plate (PP), (5) Exit aperture at PP (straight channel), (6) Alignment Window, (7) Electrical Feed through, (8) Grounded Plate (PG), (9) Entrance aperture, (10) Exit apertures at GP (Energy Channels), (11) CEM-detector, (12) Guard Rings.
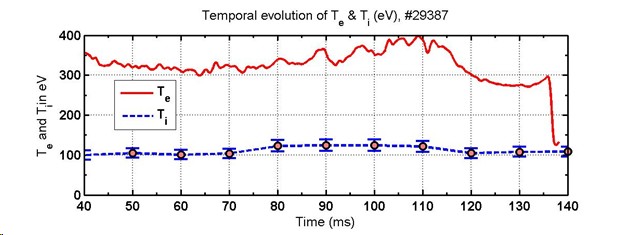
Temporal evolution of core-ion temperature Ti0 and core electron temperature Te0 for Plasma discharge#29387 of Aditya tokamak during plasma current flattop
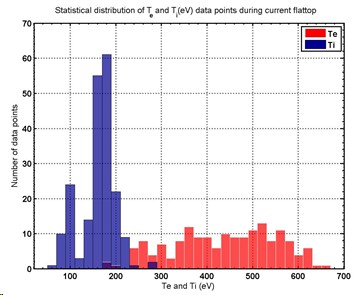
Statistical distribution of temperatures measurement data points for Ti0 and Te0 during plasma current flattop for various discharges of Aditya tokamak having Ip~133±15kA
References:
1) Snehlata Aggarwal and Kumar Ajay, Design and Development of Passive Charge Exchange Neutral Particle Analyser for ADITYA-U Tokamak, EX/P4-23, 27th IAEA Fusion Energy Conference (FEC-2018) preprint, 22–27 October 2018, Ahmedabad, India
2) Kumar Ajay, Santosh P. Pandya, Snehlata Aggarwal, Aditya tokamak team, (2020) “Experimental Results of Core Ion Temperature and Neutral Density Measurements on ADITYA Tokamak using Four Channels Neutral Particle Analyzer”, Journal of Fusion Energy 39:3, 111-121.
3) K. Ajay, S. Aggarwal, and S. P. Pandya, ADITYA Experimental Results of Core Ion Temperature Measurements on ADITYA Tokamak Using Four Channel Neutral Particle Analyser, EX/P4-25, 27th IAEA Fusion Energy Conference (FEC-2018) preprint, 22–27 October 2018, Ahmedabad, India
4) Santosh P. Pandya, Kumar Ajay, Priyanka Mishra, Rajani D. Dhingra and J. Govindarajan, “Core-Ion Temperature Measurement using Passive Charge Exchange Neutral Particle Energy Analyzer for the ADITYA tokamak”, Review of Scientific Instrument, 84(2), p023503, (2013).
5) Kumar ajay, santosh P. Pandya, snehlata gupta agarwal and the Aditya team, Analysis of neutral particle analyzer measurements on the Aditya tokamak for estimating neutral hydrogen densities and core ion temperatures during ohmic plasma discharges, IPR/RR-764/2015, December 2015
6) Kumar Ajay, Santosh P. Pandya and Snehlata Gupta, “An analytical estimation of the passive charge exchange neutral flux reaching the Electrostatic Parallel Plate based neutral particle Analyzer (EPP-NPA) deployed at ADITYA and expected at SST-1”, Topical Conference on Atomic processes in plasmas" 18-20th November 2013 at IPR , Gandhinagar, India.
Infrared Thermography and Infrared Imaging
Infrared Thermography is the science of acquisition and analysis of thermal information by using non-contact thermal imaging devices. Visible photograph depicts spatial distribution of light or colour intensity similarly “thermo-graph” depicts spatial distribution of temperature values.
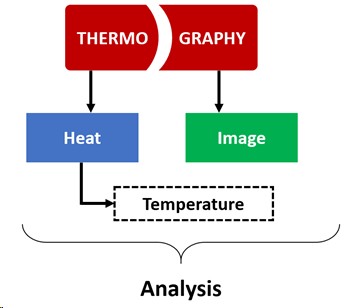
Plasma diagnostics based on the Infrared Thermography technique (IRT)
Infrared Thermography emerged as an important tool in the field of high temperature plasma diagnostics and fusion research since it has the advantage of real time imaging of the surface temperature of an object, remotely. Infrared imaging has multiple applications. It can be used for surface temperature measurement of Plasma Facing Components (PFCs) for studying the plasma wall interaction and also for health and safety monitoring of the PFCs. It is also used for in-vessel inspection during plasma discharges and heat load estimation on the PFCs, whereby establishing power balance between input and the exhaust power from the plasma. Another important application of Infrared imaging technique is for estimation of particle flux and radiation flux emitted from the confined plasma in broad wavelength range by using an Infrared Imaging Video Bolometer. Infrared imaging also finds an important application for studying the synchrotron radiation emitted by “Runaway Electrons” accelerated by toroidal electric field. The radiation emitted by such electrons falls in IR range which can be detected by Infrared imaging & various parameters of “Runaway Electrons” can hence be derived. Infrared imaging diagnostics are less susceptible to the electro-magnetic and nuclear radiation induced noises, provided suitable shielding techniques are used. Considering all the merits of Infrared imaging diagnostics it can be concluded that it is an inevitable diagnostic for fusion research. Different Infrared imaging diagnostics are deployed on the ADITYA-U and SST-1 tokamaks. Brief disruption of each diagnostics is given below.
Infrared Thermography (IRT) of Plasma Facing Components
Infrared Thermography (IRT) of Plasma Facing Components (PFCs, namely Limiter, Divertor etc.) is one of the most essential tools to investigate interaction of plasma with PFCs as it has an advantage of real time monitoring of the surface temperatures remotely with wide field of view (FOV). There is a possibility of damage to the PFC tiles due to intense localized heating load under various conditions and also the particles ejected from the tiles can affect plasma boundary condition. For this reason, infrared thermographic measurement has become important for monitoring surface temperature and estimating thermal loads on inboard and out board limiter tiles. Infrared imaging system provides information on excessive temperature of component or power deposition profile on the PFCs.
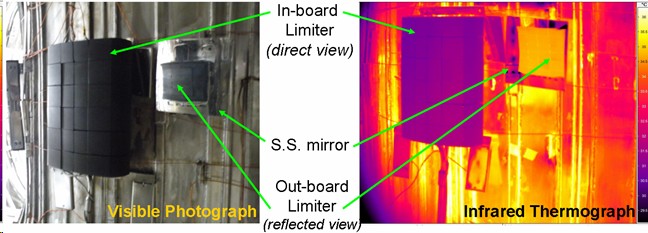
Visible photograph (left) shows in-board limiter and out-board limiter (mirror reflection) of the SST-1 tokamak from IR-camera view-port. Corresponding IR-thermograph shows in-board limiter tiles and out-boards limiter tiles covered in the same field of view of the IR-camera
An IRT system is deployed on the ADITYA-U and SST-1 tokamak. The system has wide field of view which covers inboard limiter in direct view and outboard limiter in reflected view using stainless steel mirror mounted on the inboard side. Presently this IRT system has measurement role for health monitoring of the limiter tiles, estimation of heat-flux impinging on PFCs and physics studies.
Infrared Imaging Video Bolometer (IRVB)
Infrared Imaging Video Bolometer (IRVB) is one of the modern plasma diagnostic which provides the measurement of the temporally resolved two & three dimensional (2-D / 3-D) power profile radiated from the plasma devices. It utilizes free standing ultra thin large area metal foil, which absorbs radiated power from high temperature magnetically confined plasma through pinhole camera geometry in wide spectral range (SXR to UV). This absorbed power alters the temperature profile on the foil area which is optically (by infrared radiation) imaged and measured by the Infrared Camera seating out side the vacuum vessel through Infrared Transmitting vacuum view port. Using heat diffusion analysis of 2-D temperature profile, total radiated power profile from plasma can be determined. Since the IRVB is optically transmits the signals (Infrared Radiation) it is immune to EM noise and also can work under reactor relevant conditions, hence it is more suitable for the steady state high temperature plasma devices and future fusion devices.
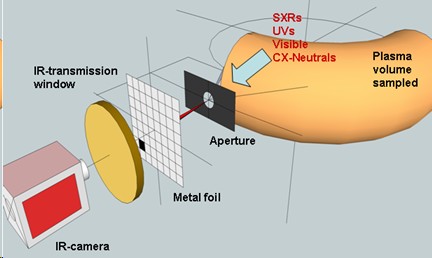
The techniques is being first time utilize for the medium size tokamak the ADITYA-U. IRVB system is designed, developed and installed on the SST-1 tokamak also.
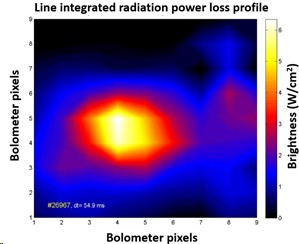
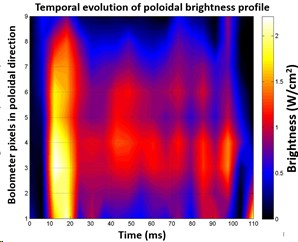
Plasma power brightness profile from the ADITYA-U IRVB-system (left) and temporal evolution of poloidal brightness profile (vertical array, x=1 & y=1:9) for the plasma discharge #26766 (right)
Detection of synchrotron radiation emitted by “Runaway Electrons” using IR-Camera
Runaway Electrons (REs) generation and energy dynamics is a major concern for the present day tokamaks. This may occur during different phases of the plasma discharge like start-up, flat-top, ramp-down, failed breakdown or during disruptions. Production of REs depends on toroidal electrical filed and plasma density. In large tokamaks, REs can be confined for long durations hence, they gain energy up to few tens of MeVs and with significant fraction of discharge plasma current. It is essential to estimate RE parameters, namely: density, energy, energy distribution function and pitch angle etc. since they can cause substantial damage to first wall and other in-vessel components of a tokamak if they are deconfined.
The main reasons for investigating REs are: (a) Machine protection since deconfined REs can cause severe damage to the first wall, (b) Basic Control to prevent such mishaps, (c) Physics studies since REs can act like test particles to investigate turbulent transport due to magnetic or electric fluctuations.
Conventional runaway diagnostics measures those runaways that are no longer confined (Hard X-Ray monitor). Soft X-Ray-array and Fast Electron Bremsstrahlung-array has limitation to detect high energy REs (Energy> 20 MeV). This demands a new diagnostic technique which detects REs when they are still confined inside the plasma and should detect REs with high energy also.
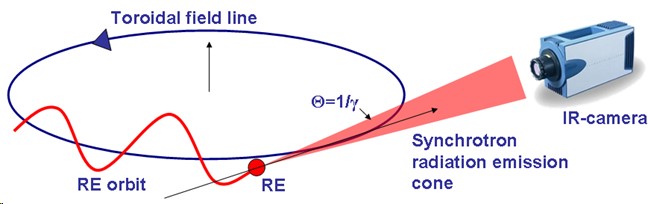
It is well known that accelerated charge particles emit electromagnetic radiation. For relativistic electrons in a magnetic field, this emission is called synchrotron radiation. For typical tokamak parameters, the synchrotron radiation spectrum peak falls in the infrared band. The synchrotron radiation measurement with Infrared imaging camera provides a tool to detect REs when they are still confined within the plasma. Detection of synchrotron radiation and analysis provides RE parameters namely, Pitch angle, beam radius, energy and current.
Apart from these plasma diagnostics, the IRT technique has also been applied to various thermography-related applications in IPR such as NDT&E of PFCs, remote heat-flux measurement of surface, remote temperature monitoring of a large size vessel.
References:
List of the publications / patents
Patents
1) Santosh P. Pandya, Shwetang N. Pandya and J. Govindarajan “Multilayer Sensing Module for Infrared Imaging Bolometer” applied for the Indian Patent, Application No.:2834/MUM/2010, filed on October 12, 2010. (Patent is under examination by patent office Mumbai, INDIA)
List of Publications:
Published in Refereed / peer reviewed Journal:
1) Byron J. Peterson, Roger Reichle, Santosh Pandya, Martin G. O’Mullane, and Kiyofumi Mukai, "Consideration of signal to noise ratio for an imaging bolometer for ITER", Review of Scientific Instruments 92, 043534 (2021); https://doi.org/10.1063/5.0043201
2) Santosh P. Pandya, Shwetang N. Pandya, Alexander E. Shevelev, Vladimir V. Rozhdestvensky and Sergei I. Lashkul, "A diagnostic approach for the detection of spatially distributed low energy confined runaway electrons in the Aditya-U tokamak by means of synchrotron emission imaging in the sub-millimetre wavelength band", 27th IAEA Fusion Energy Conference - IAEA CN-258, October 22-27, 2018, Gandhinagar, India, Contribution ID : 687. Paper ID: EX/P4-21
Priprint link: https://conferences.iaea.org/indico/event/151/papers/5811/files/4569-FEC_2018_preprints_v3_santosh_Uploaded.pdf
3) Shwetang N. Pandya , Byron J. Peterson, Masahiro Kobayashi, Santosh P. Pandya, Kiyofumi Mukai and Ryuichi Sano, “A reconsideration of the noise equivalent power and the data analysis procedure for the infrared imaging video bolometers”, Review of Scientific Instruments, Volume: 85, Issue: 12, 123501, Issue 12, p1, (2014).
4) Sanjeev Kumar Sharma, Bharathi P , Prahlad V , Pareshkumar J. Patel , Bhargav Choksi , Mukti Ranjan Jana , Laxmikant Bansal , Karishma Qureshi , Sumod C , Vijay Vadher , Dipal Thakkar , Laxmi Narayan Gupta , Rambabu S , Sanjay Parmar, Nilesh Contractor , Ananta Sahu , Bhargava Pandya, Sridhar B., Santosh P. Pandya, Ujjawal Baruah, "Characteristics of the positive ion source at reduced gas feed", Review of Scientific Instruments, Volume: 85, Issue: 11, 113504, (2014).
5) Santosh P. Pandya, Shwetang N. Pandya, Zubin Shaikh, Shamsuddin Shaikh, Jagannathan Govindarajan and ADITYA Team, "Development of Infrared Imaging Video Bolometer for the ADITYA Tokamak", Plasma and Fusion Research, Vol.7, 2402089 (2012).
6) Kumudni Tahiliani, Santosh P. Pandya, Shwetang Pandya, Ratneshwar Jha, and J. Govindarajan, "Nondestructive test of brazed cooling tubes of prototype bolometer camera housing using active infrared thermography", Review of Scientific Instruments, Vol. 82, Issue 1, 014901 (2011).
7) K. P. Singh, Santosh P. Pandya, S. S. Khirwadkar, Alpesh Patel, Y. Patil, J. J. U. Buch, M. S. Khan, Sudhir Tripathi, Shwetang Pandya, J. Govindrajan, P. M. Jaman, Devendra Rathore, L. Rangaraj and C. Divakarb, “Pre-qualification of brazed plasma facing components of divertor target elements for ITER like tokamak application”, Fusion Engineering and Design, Vol. 86, Issues 9–11, October 2011, Pages 1741–1744.
8) M. Selva Kumar, Santosh P. Pandya, N. M. Nandhitha, B. Sheela Rani, “Applications of Stockwell Transform in Signal/Image analysis - A Review”, CiiT International Journal of Digital Image Processing, Issue: March 2012, DOI: DIP032012012.
9) Payal Mehta, Arun Sarma, Joydeep Ghosh, Shwetang Pandya, Santosh Pandya, Paritosh Choudhuri, J. Govindarajan, C. Ionita Schrittwieser, Roman Schrittwieser, “Measurement of Emission Current & Temperature Profile of Emissive Probe materials Using CO2 Laser”, Current Applied Physics, Volume 11, Issue 5, September 2011, Pages 1215–1221.
10) Payal Mehta, Arun Sarma, Joydeep Ghosh, Shwetang Pandya, Santosh Pandya, Paritosh Choudhuri, J. Govindarajan, C. Ionita Schrittwieser and Roman Schrittwieser, “Temperature Profile of Graphite Material Using Co2 Laser”, Physica Scripta, Volume 82 (2010), Number 5, 055402.
Paper and presentation published in International Conference and proceedings / Meetings:
1) Santosh P. Pandya, Shamsuddin Shaikh, Kanchan Mahavar, Zubin Shaikh, Shwetang N. Pandya, Kumar Ajay, J. Govindarajan and ADITYA team, “Tangential viewing Infrared Imaging Video Bolometer developed for the ADITYA tokamak and comparison of its results with 2-D plasma power loss model” 9th General Scientific Assembly of the Asia Plasma and Fusion Association in – 2013 (APFA-2013), Korea, November. 5th to 8th, 2013. HO1-4. (Oral Presentation)
2) Santosh P. Pandya, Shwetang N. Pandya and J. Govindarajan, “Design and Development of Infrared Imaging Video Bolometer for ADITYA Tokamak”, 21st International Toki Conference (ITC-21), November 28 - December 1, 2011, Ceratopia Toki, Toki-City, Gifu, Japan. Paper No.:112.
3) Santosh P. Pandya, Shwetang N. Pandya, Shamsuddin Shaikh, Zubin Shaikh, J. Govindarajan and ADITYA team, “Preliminary results of the Infrared Imaging Video Bolometer developed for the ADITYA tokamak and its comparison with 2-D radiation power loss model”, 22nd International Toki Conference (ITC-22), November 19-22, 2012, Ceratopia Toki, Toki-City, Gifu, Japan. (Paper No.: P1-49).
4) K.P.Singh, Santosh P. Pandya, S.S.Khirwadkar, Alpesh Patel, Y.Patil, J.J.U.Buch, M.S Khan, Sudhir Tripathi, Shwetang N. Pandya, J.Govindrajan, P.M.Jaman, Devendra Rathore, L.Rangaraj, C. Divakar “Pre-qualification of Plasma Facing Components of Divertor Target Elements for ITER like Tokamak Application ” Proceedings of the 26th Symposium on Fusion Technology - 2010, Porto, Portugal. September 27- October 1, 2010, P3-84.
5) Manoj Kumar, Sanjay Kulakarni, Santosh Pandya, J. Govindrajan, and Ajai Kumar, "Measurements with Imaging Diagnostics on Aditya Tokamak", 19th High Temperature Plasma Diagnostics Conference, HTPD-2012, USA, May 6-10, 2012, P.4.45.
Technical Reports
1) Santosh P. Pandya, Kumar Ajay, Priyanka Mishra, Rajani D. Dhingra and J. Govindarajan, “Core-Ion Temperature Measurement of Aditya Tokomak using Passive Charge Exchange Neutral Particle Energy Analyzer”, IPR/TR-180/2011, August-2011, IPR library.
2) Kumudni Tahiliani, Santosh P. Pandya, Shwetang Pandya, R. Jha and J. Govindarajan, “Non-Destructive Test of Brazed cooling Tubes of Prototype Bolometer Camera Housing using Active Infrared Thermography”, IPR/TR-156/2009, Septermber-2009, IPR library.
Research Report
1) Kumudni Tahiliani, Santosh P. Pandya, Shwetang Pandya, Ratneshwar Jha and J. Govindarajan, “Non-Destructive Test of Brazed cooling Tubes of Prototype Bolometer Camera Housing using Active Infrared Thermography”, IPR/RR-472/2010, April-2010, IPR library.
X-ray Diagnostic
High temperature and density plasma emit in electromagnetic spectra, which includes X-rays. These X-rays hold very important information regarding the plasma interior as well as the plasma boundary. Temporal monitoring of X-ray emission serves a wide range of physical phenomena which assists in better understanding of the tokamak plasma. MHD activities, disruptions, plasma start-up, identification of the magnetic axis, plasma boundary, electron temperature are some of the important physics objectives for which the X-ray diagnostic are designed. X-ray emission ranges between a few hundreds of eV to a few tens of MeV. Tokamak X-rays are majorly divided into two groups Soft X-ray (~800eV -30keV) and Hard X-rays (~100 keV to a few MeV).
Soft X-ray (SX) Diagnostic (~800 eV - ~30 keV)
S.N
| Name
| Operation mode
| Channels
| Information
|
1
| Soft X-ray Monitor
| current mode
| 1
| temporal X-ray emission behaviour
|
2
| Soft X-ray tomographic array
| current mode
| 16
| Temperature profile, MHD studies
|
3
| Soft X-ray spectrometer
| Pulse mode
| 1
| Spectroscopy
|
A soft X-ray tomographic system is intended to perform the tomographic reconstruction for the identification of the equilibrium emission profile as well as the realization of the magnetic islands available within the plasma, employing a silicon diode array. The diagnostic is a perpendicular viewing (perpendicular to BT) system consisting of 4 arrays, having 16 individual channels. Presently one array is operational and the rest is under a different stage of development. Along with the tomographic reconstruction the SX diagnostic is also employed in plasma electron temperature estimation, via the foil method. To facilitate the same an additional array is placed with an extra filter for the determination of the electron temperature.
A soft X-ray monitor is a single channel-wide FOV x-ray detector system that gives an overall SX emission pattern in temporal space. Silicon barrier detectors (SBD) are employed for this objective, which offers a large collection area honoring the wide FOV requirement.
SX spectrometer is a single channel Silicon drift detector based spectrometer. The spectroscopy is majorly done for the plasma start-up phase as well as ECR assisted plasma start-up experiments. The system is capable of the realization of the non-thermal electron temperature, as well as the fast electron – wall interaction at the initial phase of the plasma initiation.
The AXUV detector system, Silicon Barrier Detector (SBD), Silicon Drift Detector (SDD) detector system
Hard X-ray (HX) Diagnostic (~100 keV - ~10 MeV)
The hard X-rays, HX, are produced by the runaway electrons (RE). RE is the most undesirable electron population for any given tokamak plasma, and identification/ subsequent mitigation is a principal requirement for any successful tokamak plasma operations.
S.N
| Name
| Operation mode
| Channels
| Information
|
1
| Hard X-ray monitor
| current mode
| 2
| HX temporal monitoring
|
2
| Hard X-ray Spectrometer
| Pulse mode
| 1
| Hard X-ray spectroscopy
|
The two HX monitors are the tangential viewing wide FOV NaI-based scintillator which monitors the HX emission in the temporal space. The HX burst is one of the key pieces of information which is obtained from these systems.
The Hard X-ray Spectrometer system is LaBr (1.5 inches x1.5 inch) scintillator detector based spectrometer, which is again a wide FOV single-channel system. This offers the temporal evolution of the HX spectra for any given tokamak plasma discharge. The diagnostic main objective is to give the runaway electron temperature.
NaI based HX system, LaBr based HX spectrometer
References
S. Purohit et al 2020 Nucl. Fusion 60 126042
S. Purohit et al 2020 JINST 15 P08015
S. Purohit et al Plasma and Fusion Research, 2017, Volume 12
S. Purohit et al Rev. Sci. Instrum. 85, 11E419 (2014)
Optical Imaging Diagnostics
Optical imaging diagnostics is installed both in Aditya U and SST-1. This diagnostics consist of wound imaging fiber bundle, objective lens, 1:1 relay lens and CCD camera. Since there is very high magnetic field in the machine so cameras can not be placed directly in the machine. To resolve this problem, Wound imaging fiber bundle is used to transport the plasma images from inside of the machine to outside and then it is coupled to CCD camera.
This diagnostics is used to measure plasma movement, plasma breakdown, plasma wall interaction etc.

Helium beam diagnsotics and impurity injector system development
Spatially resolved edge measurements are important for the fusion research and super sonic molecular helium beam is one such diagnsostics which can provide such spatially and temporaly resolved tempeature and density. In this diagnsotics a molecular beam of helium is injected in to the edge of plasma and the emission from the helium neutrals are modeled to extract the temperature and density of edge plasma.

This diagnostics is in its development stage and after the complete testing, calibrations and validation will be integrated to the tokamak.
References:
1) Flow characterization of supersonic gas jets: Experiments and simulations Vacuum ,Volume 192, October 2021, 110440 : https://doi.org/10.1016/j.vacuum.2021.110440.
2)Helium beam diagnostics for the estimation electron temperature and density in SST-1. Asia Plasma and Fusion Association (APFA)- 2015 http://dx.doi.org/10.13140/RG.2.1.3991.2562
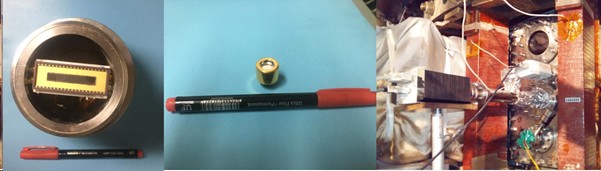
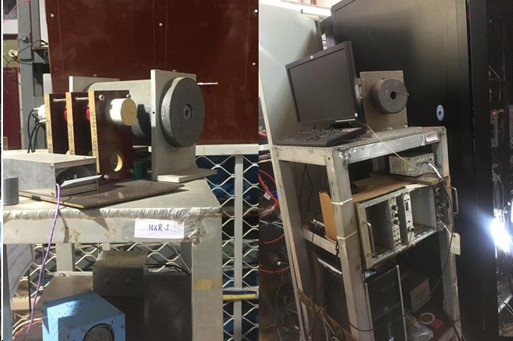
LIBS and Micro Raman system for Tokamak
Substantial interest on the postmortum analysis of plasma facing components using LIBS and Micro raman system has been seen in the recent times. A configurable raman system is procured for this purpose and is operational. In addition to the micro raman system, a Laser induced breakdown spectroscopic system is also included for the detailed analysis of modification of surface as well as the composition of plasma facing components. Significant basic testing and calibrations have been performed in lab for the implementation of this diagnsotics.
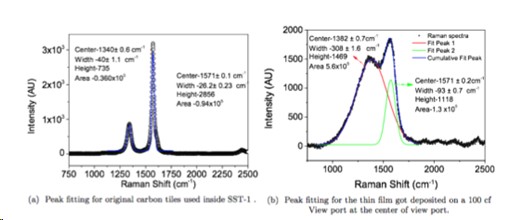
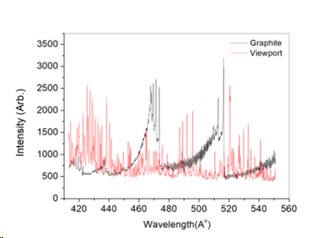
Micro raman and LIBS spectra of SST-1 view port coatings
References:
1) COMPOSITIONAL ANALYSIS OF THE DEPOSITS IN SST-1 TOKAMAK : IPR/RR-1258/2021
2) Study of the different parts of a tokamak using laser-induced breakdown spectroscopy. https://doi.org/10.1016/B978-0-12-818829-3.00017-4
Basic Laser Plasma Experiments
In addition to the diagnsotics of tokamak basic emperiments on laser produced plasma is also conducted to study the high density low temperature plasma dynamics using different diagnsotics. Various diagnsotics setups are developed for this. This work is co-ordinated to support the diagnostics of tokamak as in the caseof LIBS and helium beam diagnostics.
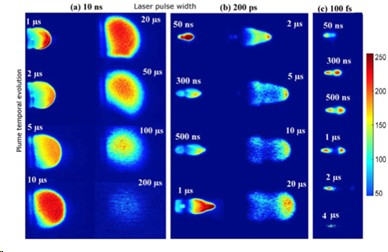
Effect of Laser pulse width on Plume evolution
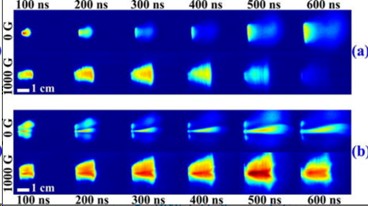
Effect of magnetic fieldon colliding plasma
References
1) Observation of ion acceleration in nanosecond laser generated plasma on a nickel thin film under rear ablation geometry. Phys. Rev. E 102, 043205. https://doi.org/10.1103/PhysRevE.102.043205
2) Effect of magnetic field on the lateral interaction of plasma plumes: Physics of Plasmas 27(9):093109. http://dx.doi.org/10.1063/5.0006647
3) Neutral and ion composition of laser produced lithium plasma plume in front and back ablation of thin film: Journal of Analytical Atomic Spectrometry. http://dx.doi.org/10.1039/C9JA00158A
4) Spectroscopic investigation of molecular formation in laterally colliding laser-produced carbon plasmas. Applied Optics Vol. 58, Issue 3, pp. 561-570 (2019) . https://doi.org/10.1364/AO.58.000561
5) Pulse width dependent dynamics of laser-induced plasma from a Ni thin film. Journal of Physics D Applied Physics 52(13). http://dx.doi.org/10.1088/1361-6463/aaff43
6) Emission analysis of a laser-produced barium plasma plume. Applied Optics 54(25):7673. http://dx.doi.org/10.1364/AO.54.007673
- Thomson Scattering system
- Microwave Diagnostics
- Magnetic Diagnostics
- Bolometer Diagnostics
- Magneto-Optic Current Sensor (MOCS) diagnostics
- Fast Visible Imaging Diagnostics
- Charge exchange Neutral particle analyzer diagnostic
- Infrared Thermography and Infrared Imaging
- X-ray Diagnostic
- Optical Imaging Diagnostics
- Helium beam diagnsotics and impurity injector system development
- LIBS and Micro Raman system for Tokamak
- Basic Laser Plasma Experiments